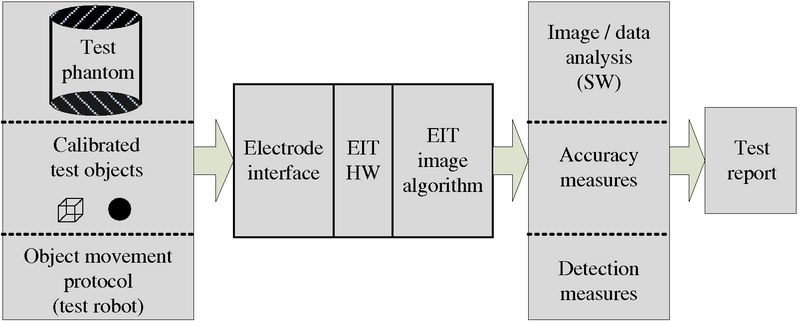
Figure: Schematic diagram of proposed test setup and procedure to evaluate EIT system performance
To evaluate and compare the performance of a complete EIT system, we proposed a test methodology and phantom system design based on reproducible procedures with completely characterized and traceable test objects. Components of system performance evaluation are shown in figure 1:
Figure: Schematic diagram of proposed test setup and procedure to evaluate EIT system performance
An EIT system consists of an electrode interface, EIT stimulation and measurement hardware and an image reconstruction algorithm. Measurements are performed using a specified measurement protocol and characterized traceable test objects.The data and images are systematically analysed by performance analysis algorithm.
Evaluation procedure:
Three important components for this test are test phantoms, a test protocol, and evaluation methodology/software. The EIT system is connected to the phantom, and three sets of measurements are performed:
(a) |

(b) |

(c) |
| A. | data and image noise, and data accuracy, |
|---|---|
| B. | detectability and distinguishability of single and multiple contrasts, and |
| C. | Accuracy of reconstructed images. |

The calculation of these figures of
merit is illustrated in figure below:

For better performance, it is desirable for AR, PE and RES to be constant, while PE, RES and RNG should be as small as possible for any target position.
Last Modified: $Date: 2017-02-28 13:12:08 -0500 (Tue, 28 Feb 2017) $ by $Author: aadler $