|
|
EIDORS: Electrical Impedance Tomography and Diffuse Optical Tomography Reconstruction Software |
|
EIDORS
(mirror) Main Documentation Tutorials − Image Reconst − Data Structures − Applications − FEM Modelling − GREIT − Old tutorials − Workshop Download Contrib Data GREIT Browse Docs Browse SVN News Mailing list (archive) FAQ Developer
Hosted by |
Reconstruction and waveforms of lungsDataThis tutorial shows interesting lung images and waveforms which can be reconstructed from EIT data. This example uses data from a 10-day old spontaneously breathing neonate. In a prone position with the head to the left, most of the tidal volume flows to the right lung.
Data are available Here. Data were recorded from a 10-day old spontaneously breathing neonate lying in the prone position with the head turned to the left, as documented in: S. Heinrich, H. Schiffmann, A. Frerichs, A. Klockgether-Radke, I. Frerichs, Body and head position effects on regional lung ventilation in infants: an electrical impedance tomography study. Intensive Care Med., 32:1392-1398, 2006. Download data
%zn = 'if-neonate-spontaneous.zip';
%urlwrite(['http://eidors3d.sf.net/data_contrib/if-neonate-spontaneous/',zn],zn);
zipfilecontents = unzip('../../data_contrib/if-neonate-spontaneous/if-neonate-spontaneous.zip');
Select reconstruction algorithmHere we use the GREIT algorithm on a neonate_16el geometry.
fmdl = mdl_normalize(mk_library_model('neonate_16el'),1);
[fmdl.stimulation,fmdl.meas_select] = mk_stim_patterns(16,1,'{ad}','{ad}');
opt.imgsz = [64 64]; opt.noise_figure = 0.5;
imdl = mk_GREIT_model(mk_image(fmdl,1), 0.25, [], opt);
Show reconstructed image
vv= eidors_readdata('P04P-1016.get'); vi=vv(:,45); vh=vv(:,61);
imr = inv_solve(imdl,vh,vi);

clf; axes('position',[0.05,0.5,0.25,0.45]);
imr.calc_colours = struct('ref_level',0,'greylev',0.2,'backgnd',[1,1,1]);
show_slices(imr);
Indicate points to show waveforms
yposns = [45  20 50]; xposns = [50  40 27]; ofs= [0,22,15];

% Show positions on image
hold on; for i = 1:length(xposns)
    plot(xposns(i),yposns(i),'s','LineWidth',10);
end; hold off;
Show waveforms in the lungs and heart
% Show plots
imgs = calc_slices(inv_solve(imdl, vh, vv));
axes('position',[0.32,0.6,0.63,0.25]);

taxis =  (0:size(imgs,3)-1)/13; % frame rate = 13
hold all
for i = 1:length(xposns);
    plot(taxis,ofs(i)+squeeze(imgs(yposns(i),xposns(i),:)),'LineWidth',2);
end
hold off
set(gca,'yticklabel',[]); xlim([0 16]);

print_convert neonate_intro04a.jpg
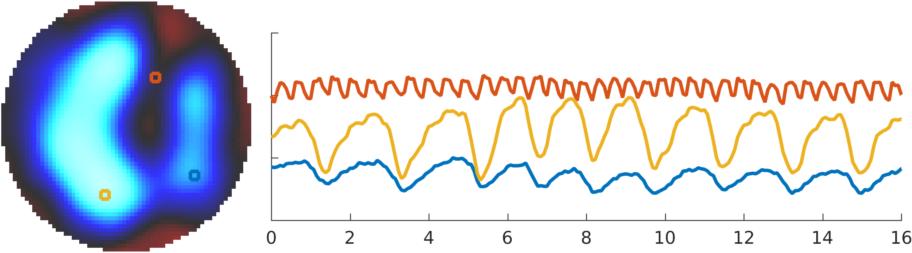
Figure: Left: Recontructed tidal images, and Right: pixel waveforms in the (red) heart, right lung (yellow) and left lung (blue) |
Last Modified: $Date: 2018-03-20 17:30:05 -0400 (Tue, 20 Mar 2018) $ by $Author: aadler $