Contributed EIT Data:
| Authors:
|
David P Byrne,
Nicole Studer,
Cristy Secombe,
Alexander Cieslewicz,
Giselle Hosgood,
Anthea Raisis,
Andy Adler, Martina Mosing
|
|---|
| Date:
| 2024
|
|---|
| Brief Description:
|
These are the data for the calculation of figure 4 in the referenced paper. Two-planes of 16 electrodes each were placed onto a healthy horse and EIT data acquired with a "square" electrode pattern with skip-4 using a Sentec BBVet EIT system. The horse was standing and breathing at rest. A rebreathing mask was placed and the animal increased tidal volume and breathing frequency increased.
A 3 minute section of the real (in-phase) component of data was extracted. Data were filtered at 5 Hz with an anti-aliasing filter and subsampled by a factor of 5 (to 9.53 samples/sec).
Data were published in:
DP Byrne, N Studer, C Secombe, A Cieslewicz, G Hosgood, A Raisis, A Adler, M Mosing
Validation of three-dimensional thoracic electrical impedance tomography of horses during normal and increased tidal volumes
Physiol Meas 45:035010, 2024.
|
|---|
| License:
| Creative Commons Artistic License (with Attribution)
|
|---|
| Attribution Requirement:
|
Use or presentation of these data must acknowledge
David Byrne, and cite this publication:
|
|---|
| Format:
|
Data are stored in Matlab v7 file format with
the fields
−data3d : Data (32×32)×frames
−time3d : Time (in seconds)
−frame_rate
−description
|
|---|
| Methods:
|
See referenced paper
|
|---|
| Data:
| Data
|
|---|
The data may be analyzed with the following code:
load byrne2024-horse-data3d.mat

ng_write_opt('MSZCYLINDER',[0.5,0.35,0.18,0.5,0.35,0.33,0.5,.01]*100);
fmdl = mk_library_model('horse_2x16el_lungs:ctr');
[fmdl.stimulation, fmdl.meas_select] = mk_stim_patterns(32,1,[0,5],[0,5],{'no_meas_current_next2'},1); % Skip 4
[~,fmdl] = elec_rearrange([16,2],'square',fmdl);

tpos =[59,111;1723,1743]';
fmdl.normalize = 0;
SZ = 32;
vopt.imgsz = [SZ, SZ];
vopt.square_pixels = true;
vopt.zvec = linspace(-0.08,0.08,10);
vopt.save_memory = 1;
opt.noise_figure = 0.4;
opt.keep_intermediate_results = true;
[imdl_t, opt.distr] = GREIT3D_distribution(fmdl, vopt);
imdl = mk_GREIT_model(imdl_t, 0.2, [], opt);
dh = mean( data3d(:,tpos(2,:)),2);
imgr = inv_solve(imdl, dh, data3d);
ROI = define_ROIs(imdl,[-2,0,2],[-2,2],[-2,2]);
subplot(611);
plot(time3d,-ROI*imgr.elem_data,'LineWidth',1.5); yl = ylim;
legend('L','R','Location','NorthWest','AutoUpdate','off');
line([1;1]*time3d(tpos(:)),yl'*[1,1,1,1],'Color',[0,0,0],'LineWidth',1.5);
ylim(yl); xlim('tight'); box off

imgr.calc_colours.ref_level = 0;
imgr.calc_colours.greylev = 0.1;
imgr.calc_colours.backgnd = [1,1,1];
imgr.fwd_model.nodes= imgr.fwd_model.nodes(:,[1,3,2])*diag([1,5,-1]);

imx = imgr;

zslice = [0.20,0.0,-0.20];
yslice = [-0.15];
oslice = [inf,.1,.1];
axlim =[min(imx.fwd_model.nodes);max(imx.fwd_model.nodes)];

for sp=1:2;
   imx.calc_colours.clim = []; %default
   imx.elem_data = imgr.elem_data(:,tpos(:,sp))*[1;-1];
   for k=0:3; subplot(6,4,[3,7]+2*sp+rem(k,2)+8*floor(k/2));
      switch k
      case 0; imx.calc_colours.transparency_thresh= 0.2;
         show_3d_slices(imx,[],yslice,zslice,oslice);
      case 1; imx.calc_colours.transparency_thresh= 0.0;
         show_3d_slices(imx,[],yslice,[]);
      case 2; imx.calc_colours.transparency_thresh= 0.0;
         show_3d_slices(imx,[],[],zslice);
      case 3; imx.calc_colours.transparency_thresh= 0.0;
         show_3d_slices(imx,[],[],[],oslice);
      end
%     set(gca,'XTickLabel',[],'YTickLabel',[],'ZTickLabel',[]);
      view(-250,20); axis(axlim(:)); axis off;
   end
   subplot(6,2,10+sp);
   imx.calc_colours.clim = 0.06;
   show_slices(imx,[flipud(zslice(:))*[inf,1,inf],[1,1;2,1;3,1]])
end
print_convert 'db-horse3d-2024-01.jpg' -p10x12
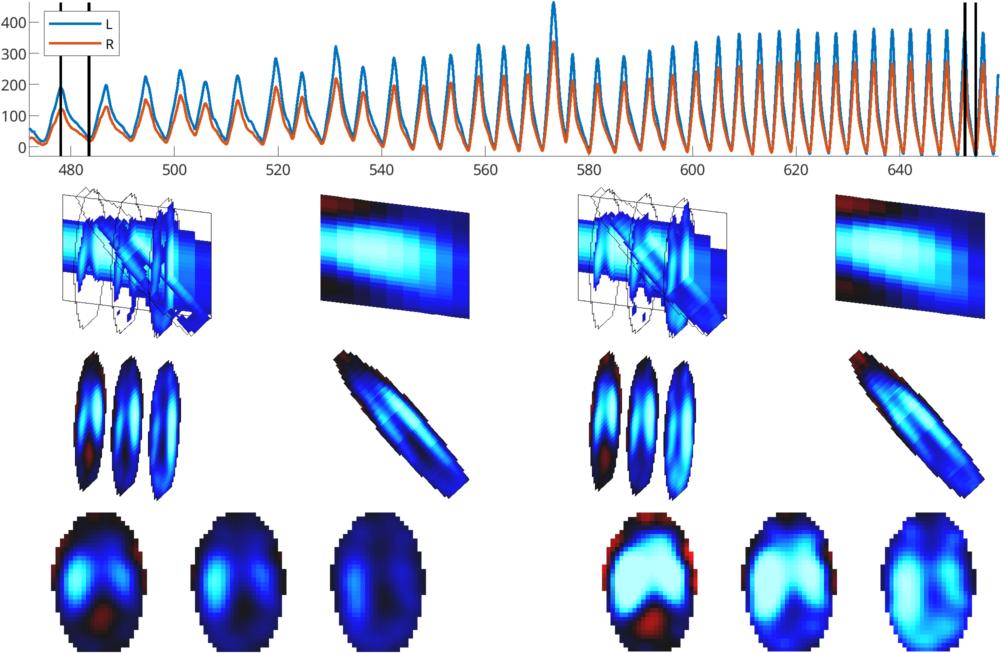 Figure similar to Figure 4 (from Byrne et al, 2024).
Multiplanar reconstruction of 3D EIT: Reconstruction of 3D EIT data from a
horse during baseline (left) and rebreathing (right). The data at each
timepoint is reconstructed into a parasagittal slice through the left lung, a
modified frontal slice through the long axis of the lung fields and three
transverse slices (from left to right: caudal, middle and cranial;
Middle images are normalized to the maximum in each image.
Bottom images are normalized to the same limit.
Figure similar to Figure 4 (from Byrne et al, 2024).
Multiplanar reconstruction of 3D EIT: Reconstruction of 3D EIT data from a
horse during baseline (left) and rebreathing (right). The data at each
timepoint is reconstructed into a parasagittal slice through the left lung, a
modified frontal slice through the long axis of the lung fields and three
transverse slices (from left to right: caudal, middle and cranial;
Middle images are normalized to the maximum in each image.
Bottom images are normalized to the same limit.
Last Modified: $Date: 2024-04-20 15:44:10 -0400 (Sat, 20 Apr 2024) $ by $Author: aadler $