

|
EIDORS: Electrical Impedance Tomography and Diffuse Optical Tomography Reconstruction Software |
|
EIDORS
(mirror) Main Documentation Tutorials − Image Reconst − Data Structures − Applications − FEM Modelling − GREIT − Old tutorials − Workshop Download Contrib Data GREIT Browse Docs Browse SVN News Mailing list (archive) FAQ Developer
|
Reconstruction of real and complex componentsMany EIT systems allow measurement of the in-phase and quadrature signals from the voltage data. From these data a complex measurement phasor is calculated. Image can be directly reconstructed, although there are some challenges in showing the images.Simulation of data with real and complex components
imdl = mk_common_model('h2d1c',16);
img = mk_image(imdl,1);
vh = fwd_solve(img);

DeltaC1 = -0.1;    %Target 1 is non_conductive
DeltaC2 = 0+0.1i;  %Target 2 has + permittivity
target= mk_c2f_circ_mapping(img.fwd_model, [[0.5;0.0;0.1],[-0.5;0;0.1]]);
img.elem_data = 1+ DeltaC1*target(:,1) + DeltaC2*target(:,2) ;
vi = fwd_solve(img);
vi = add_noise(5,vi,vh);

img.calc_colours.component = 'real';
subplot(221); show_fem(img);
title 'real conductivity change'
print_convert real_complex01a.png

img.calc_colours.component = 'imag';
subplot(221); show_fem(img);
title 'imag conductivity change'
print_convert real_complex01b.png
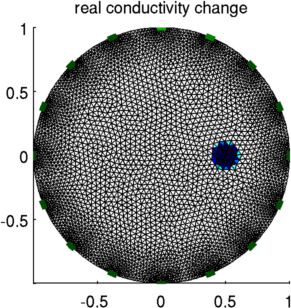
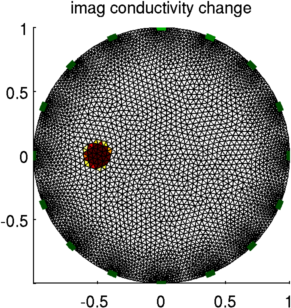
Figure: Simulated conductivity (left) and permittivity (right) changes in a circular tank Reconstruction of real and complex changes
% Create reconstruction model + solve
imdl = mk_common_model('b2d1c',16);
imgr = inv_solve(imdl, vh, vi);

imgr.calc_colours.clim = 0.02;
subplot(221); show_fem(imgr);
title 'real conductivity change'
print_convert real_complex02a.png

imgr.calc_colours.component = 'imag';
subplot(221); show_fem(imgr);
title 'imag conductivity change'
print_convert real_complex02b.png
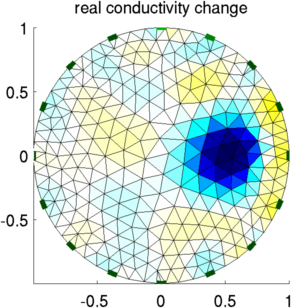

Figure: Reconstructed conductivity (left) and permittivity (right) changes. Reconstruction of real and complex changes (tank measurements)% load data with complex measurements load iirc_data_2006 vi= v_rotate(:,9); vh= v_reference; imgr = inv_solve(imdl, vh, vi); subplot(221); show_fem(imgr); title 'real conductivity change' print_convert real_complex03a.png imgr.calc_colours.component = 'imag'; subplot(221); show_fem(imgr); title 'imag conductivity change' print_convert real_complex03b.png 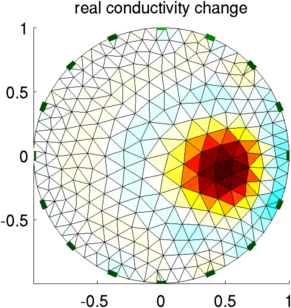
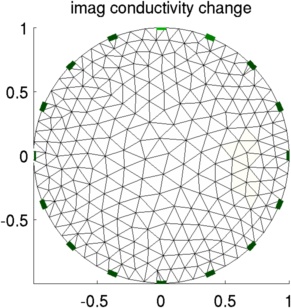
Figure: Reconstructed conductivity (left) and permittivity (right) changes from saline tank measurements at IIRC (Korea) |
Last Modified: $Date: 2017-02-28 13:12:08 -0500 (Tue, 28 Feb 2017) $ by $Author: aadler $